


How to utilize and nurture Generation Z (21)
The logistics industry has recently faced increasing business challenges due to a series of legal revisions and regulations, as well as a serious shortage of drivers. Problems encountered in the workplace are likely to become increasingly difficult to resolve.
I suspect that many of our readers are playing managers.
They are required to perform their duties effectively on the front lines while also developing and motivating their subordinates. On the other hand, some subordinates do not respond proactively, and some members suffer from a "good enough as it is" or "don't want to aim higher" syndrome (don't want to become managers or supervisors).
If everyone loses confidence and their energy levels decline, it will result in a decrease or stagnation in the operational level of logistics services, which could cause problems for our clients, the shippers, in dealing with end users. This must be avoided at all costs.
The fundamental idea behind this series is to foster motivation among younger members, including Generation Z. We hope to support them in growing into a professional group that thinks independently and finds fulfillment in improvement activities, rather than simply waiting for instructions from above.
■ Activity format that can be understood in one sheet
This time, continuing from the previous article , we will introduce a case study using an activity format that has achieved significant improvements in safety activities (accident prevention and safe driving) in the trucking department of the sales and logistics sector.
Young people, including Generation Z, are typing-oriented. They prefer easy-to-understand, single-page explanations over long, complicated manuals. This way, they can view it on their smartphones and fill it out during downtime, which is why it's so popular.
<Figure 1>
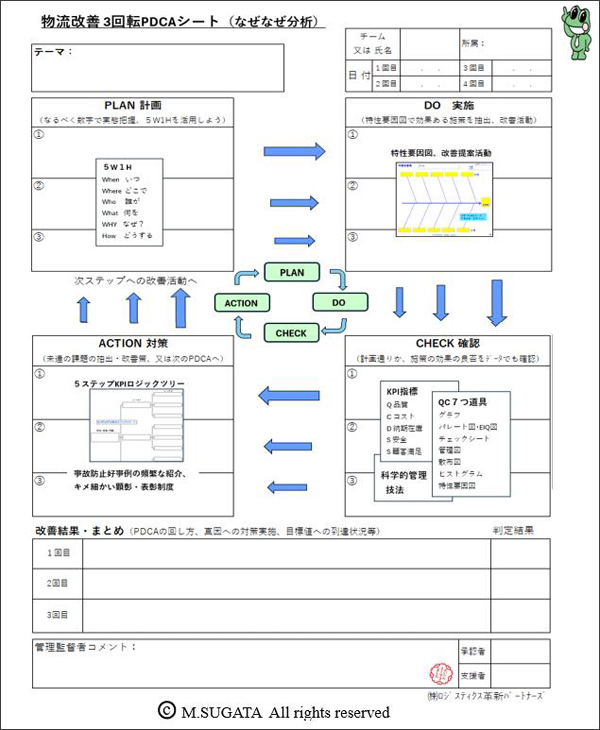
Please see Figure 1. This was prepared to promote improvement activities, particularly in the trucking operations department (drivers), which is considered to be one of the most difficult areas in the logistics sector to implement organized improvement activities.
The framework for improvement activities, which was implemented with the aim of spreading PDCA improvement activities and encouraging autonomous participation, is called the "Logistics Improvement 3-Cycle PDCA Sheet," but the original version was obtained eight years ago from a free format on BIZOCEAN's website, and then I added to and edited it.
What initially impressed me about this format was the idea of going through the PDCA cycle three times. While Toyota Production System (TPS) does indeed recommend "repeating the 'why-why' analysis five times," I had the empirical rule that in the logistics department, there aren't that many deeply rooted problems, and three repetitions are usually enough to get to the root cause.
This is a simple, one-page A4 report that also allows for the inclusion of feedback and support from supervisors. I believe this format makes it easy for everyone, even busy individuals, to fill out during vehicle downtime, allows for a clear understanding of the activity's progress, and facilitates the exchange of ideas between supervisors and improvement team members regarding the process and results. I find it particularly useful in supporting the driver department of our sales and logistics operations.
As you know, it's easy to set logistics KPI items and start collecting accident data, but simply collecting data doesn't lead to any significant improvement activities. Accidents won't decrease either. I get the impression that many companies are stuck at this stage.
The reason why improving sales logistics is difficult is,
(1) The trucking division operates with numerous dispersed bases, and drivers often work outside the office.
(2) The working environment in which the drivers are placed is harsh (they share office space within the client's base, they work in shifts and drive long distances at different times, and there are no opportunities for everyone to gather together).
(3) Individualized instruction is not being provided, and drivers are not showing interest in the monotonous training content.
There are various reasons for this. Opportunities for gathering and instruction are insufficient, and as a result, safety policies are not being thoroughly disseminated.
As I wrote last time (left side of Figure 1), in workplaces run with a sense of being forced to do things ("Don't! Do!" - don't do this, do it this way), there are few opportunities for discussion, and communication is limited to passing on information, so serious improvement activities (digging into the root causes) to reduce accidents do not progress.
I often hear from the secretariat staff that they've given up, and overcoming this situation will be the first major hurdle.
■Connecting it to individual activities
<Figure 2>
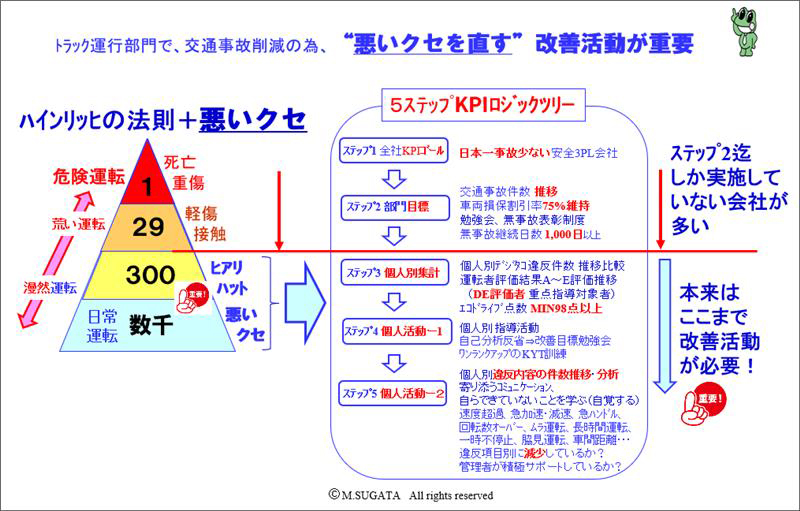
Please see Figure 2. When traffic accidents are represented using Heinrich's Law plus bad driving habits, it looks like the image on the left.
Many factors underlie serious accidents, including dangerous driving, distracted driving, and even bad driving habits in daily life. It is necessary to correct daily driving behaviors to prevent these from occurring.
In the 18th installment , we introduced the "5-Step KPI Logic Tree" activity, and an example of this can be seen on the right side of Figure 2.
Almost 100% of companies state in their management policy that safety is of paramount importance, but few companies are actually able to implement safety measures, and most companies stop at Step 2.
This approach will never lead to individual drivers taking steps to improve their driving habits, and the number of traffic accidents will not decrease.
In the lower right of the diagram, "Step 5 Individual Activities-2," examples of bad driving habits that can lead to dangerous driving are listed. It is necessary to change one's awareness and improve driving habits to reduce the occurrence of these habits to zero.
In recent years, the advancements in DX equipment for the trucking industry have been remarkable, and excellent devices such as AI dashcams have emerged that extract bad habits that lead to dangerous driving and provide feedback on the frequency of their occurrence.
For example, it tells you the number of times dangerous driving behaviors that directly lead to accidents occur, such as "failure to stop at a stop sign," "distracted driving," and "insufficient following distance," so if you proactively address these issues, you can expect to see remarkable improvements.
Based on the individual results of each driver, I hope that dispatchers, managers, and supervisors will make efforts to communicate with drivers in a supportive manner, and that they will praise, encourage, and commend drivers when they show improvement.
I would like you to actively support drivers so that they become aware of their shortcomings and begin improvement activities. When these collaborative support activities start to function, it will ignite the motivation of the drivers, and accidents will decrease dramatically.
Companies that have entered the Eco-Driving Contest of the Japan Transportation Ecology & Mobility Foundation (Ecomo Foundation) and won excellent or outstanding awards have seen a remarkable decrease in traffic accidents. Companies that have achieved a vehicle damage insurance discount rate of 75% have seen their accidents reduced to about one-fifth. It shows that it is possible if you put your mind to it.
These companies are among the top 1% of companies in the transportation sector, so they can confidently promote themselves by saying, "We are a company that prioritizes safe transportation. Please entrust your luggage to us with peace of mind."
Non-life insurance premiums are also scheduled to increase by 8.5% from this October. Don't give up.
A group of drivers who diligently practice eco-driving and safe driving will transform into a team of highly motivated individuals who feel a sense of fulfillment, excitement, and accomplishment, and who proactively strive for improvement.
These changes in mindset not only benefit your driving but also improve your business etiquette when visiting clients, so it's a win-win situation.
As improvements are made, as mentioned previously (right side of Figure 1), the workplace will be run with a sense of fulfillment, a "Well Done!" attitude, and the turnover rate will decrease. We hope that you will find ways to actively utilize KPI indicators in the sales and logistics (operations) departments.
■Series: Human Resource Development that Transforms the Workplace


